To run an IoT device year round from solar, you need to estimate how much power you will generate per day. This will vary based on geographic location, time of year and local weather conditions. Luckily, there are some really great solar databases available that can provide average daily solar irradiance data.
If you’d like more detailed assistance, you can talk to a Voltaic expert.
Plan for December
You should size your system to generate enough solar power to keep your system running during the worst months of the year. In the northern hemisphere, this is December. Further complicating things, this period of low sunlight also coincides with low temperatures which will reduce battery capacity. In parts of Africa, the worst performance will occur in the rainy season.
Online Tool for Measuring Solar Irradiance
Our favorite tool is the Photovoltaic Geographical Information System provided by the European Commission. To use it for remote IoT applications, do the following:
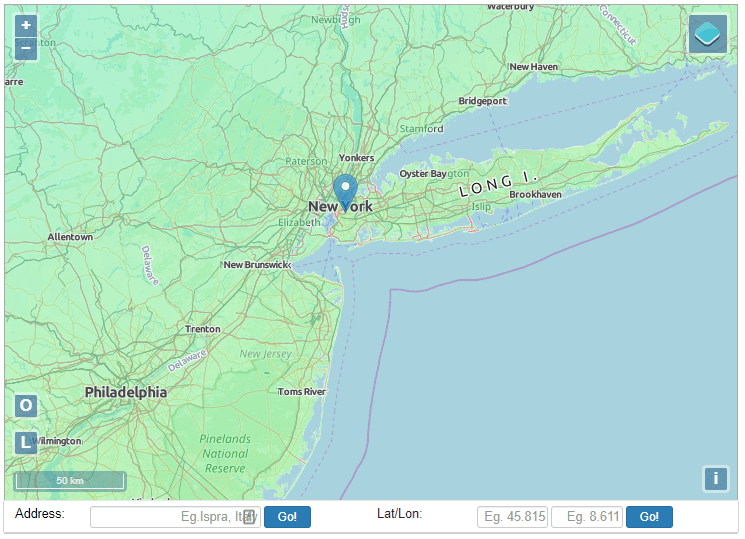
1. Select Location on the Map
2. Select Off-Grid Tab and Enter Panel Information
For this example, we’re assuming a 2 Watt panel and entered 2 for “peak PV power”.
For battery capacity, we first start with an artificially low number of 0.1, a discharge cutoff limit of 0 and consumption per day of 0.
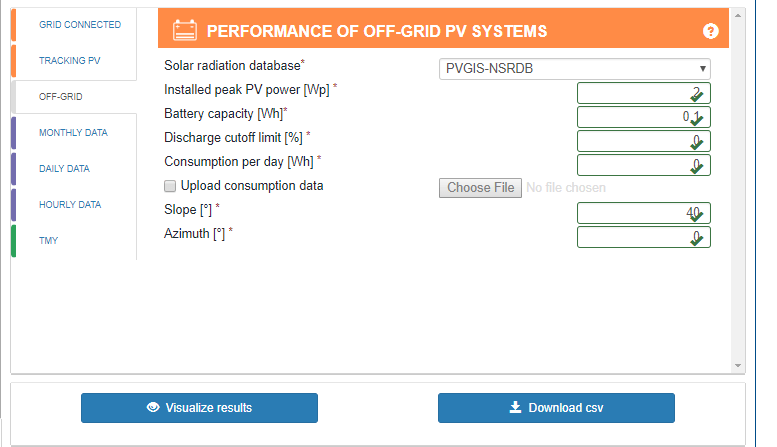
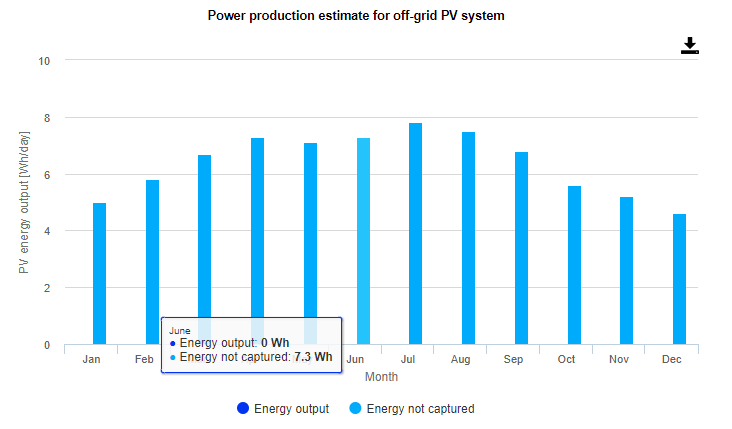
3. Click “Visualize Results”
We now see a graph of “Energy not captured” which maps how much power we would have generated per month if we had a battery included.
Maximizing Performance with Panel Angle
With traditional household systems, you are trying to maximize power production over the course of a year. With an IoT device, we are less interested in total power production then keeping the system running. Therefore in many cases, we suggest tilting the solar panel at a steeper angle to optimize for winter sun.
Here’s an example for a 2 Watt Brooklyn, NY in December and June. By angling the panel steeper, we give up 12% power in June in exchange for producing 8% more power in December.
| Angle | Power Per Day June (Wh) | Power Per Day December (Wh) |
| 40 | 7.3 | 4.6 |
| 50 | 6.8 | 4.9 |
| 60 | 6.1 | 5 |
| 70 | 5.2 | 5.1 |
Multi-Location Estimates
In many applications, systems will be placed in a range of geographic locations or move from different location. In these instances, you should plan for the worst case scenario. To continue with our example of a 2 Watt panel. Here’s how much power the system generates in June and December in Miami, Florida, Brooklyn, New York, Seattle, WA and Stockholm, Sweden. For consistency, we’ll angle the panel at the location’s latitude.
| Location | Power Per Day June (Wh) | Power Per Day December (Wh) |
| Miami, FL | 7.5 | 6.5 |
| Brooklyn, NY | 7.3 | 4.6 |
| Seattle, WA | 7.6 | 1.8 |
| Stockholm, Sweden | 7 | 0.8 |
Locations closer to the equator will tend to have more consistent power production throughout the year. Locations further north will produce far less power during winter months. A panel in Seattle in December, on average, produces 39% less solar power than the same panel in Brooklyn. That panel in Stockholm only produces 17% of the Brooklyn panel.
Plan for Worst Days & Power Losses
The Photovoltaic Irradiance model is a good starting point, but does not replace real world testing with your panel, device and battery.
The first gap is that the power production are daily averages over a month. The model doesn’t show the stretch of ten days of non-stop rain and heavy clouds that seem to appear every December in New York.
Nor does the model show power losses in batteries. Just because the solar system generates 10 Wh, doesn’t mean that there is 10 Wh available to your device. With lithium batteries, we typically assume 50% of that power is lost going into the battery and back out to the device. That power loss comes from heat as electrical energy is transferred to chemical form and back again, as well as from regulation.
You can evaluate our full range of small solar panels or submit a quote request for a custom solar panel.
Leave a Reply