We sometimes need a lightweight way to track power production of our panels in places that are far from an electrical outlet. In this post, we show you how to design a voltage, current and luminosity data logger using Adafruit’s Data Logging Shield. Our goal is to measure and track the charge rate over time of battery packs and phones from solar panels. However, you can use it to analyze the power flow between any small power supply and load. We will walk you through hardware wiring, software and calibration.
If you want a one-on-one conversation with someone from Voltaic about running small systems offgrid, you can schedule a consultation here:
Getting Started:
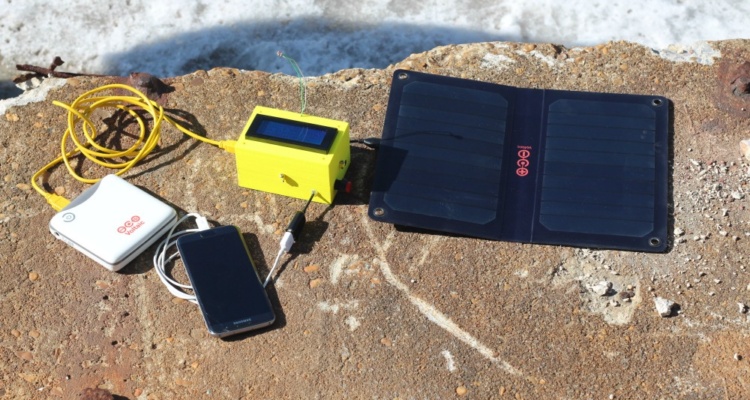
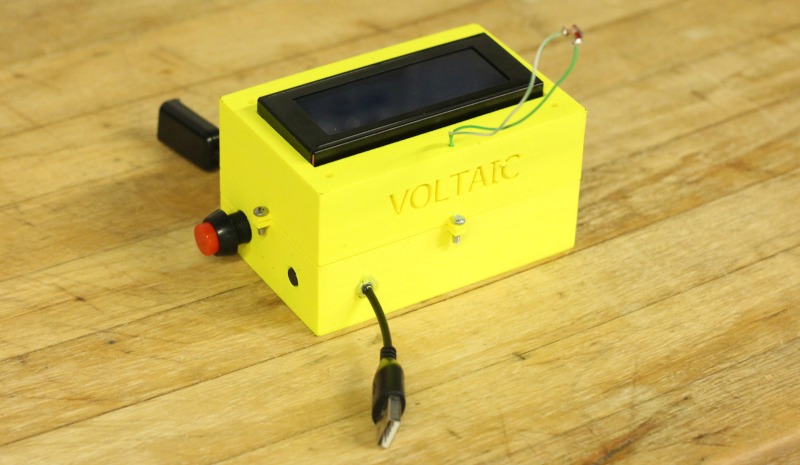
The data logger device is composed of a USB-A male socket which can be connected to solar panels, power banks or any other power generating source. On the other side, a USB-A female socket provides power output to any USB powered device including phones, tablets or battery packs. The logger records data every minute across various sensors (Current, voltage, and light) and logged the reading onto an SD card. An LCD screen provides feedback on the measurements. Power is provided by any USB battery pack.
The data logger can manage input current up to 5A and between 0 and 20V.
Parts List:
Arduino Uno
Adafruit Data Logging Shield
Sensors: Voltage, Current and Photoresistor
USB-A Male and USB Female
LCD Screen 20×4
Press Switches (x2) for screen dimming and recording on/off
10K Resistor
Jumper Wires
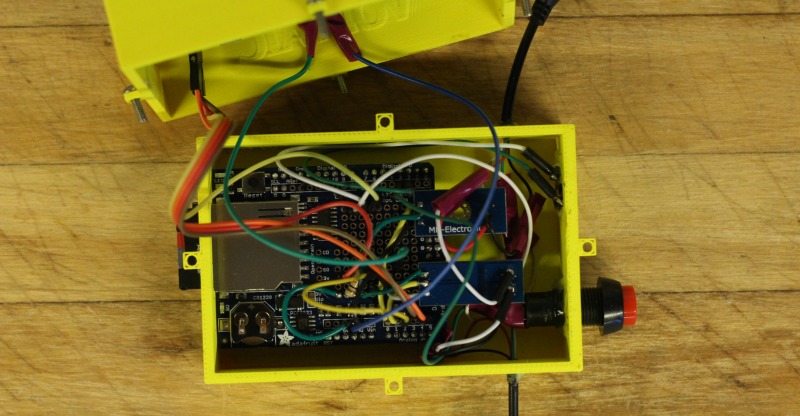
We designed and 3D printed a case for the data logger so that it would be easy and stable to transport. The bottom part stores the microcontroller, electronics, sensors, and switches the top holds the LCD. For a close look up of the model and the 3D files, go to the Sketchfab link at https://skfb.ly/6ovNS
Hardware:
The Adafruit Data Logging device provides an easy and flexible way of soldering electronics on a specific section of its shield. That ensures that the cables maintain solid connections while transporting the data logger.
To start making the connections and soldering, refer to the color coded Fritzing diagram below. Notice that the serial part of the USB (D+ D-) must be directly connected between input and output for a better configuration. Make sure that your sensors and switches are connected to the correct pins on the Arduino Uno exactly the same as in the Fritzing diagram otherwise you will have to modify the code. Also, make sure to power up the data logger device with a different power source than the one used to charge the portable device.

Here’s how the wiring looks on the shield:
Here’s the wiring to the LCD screen:
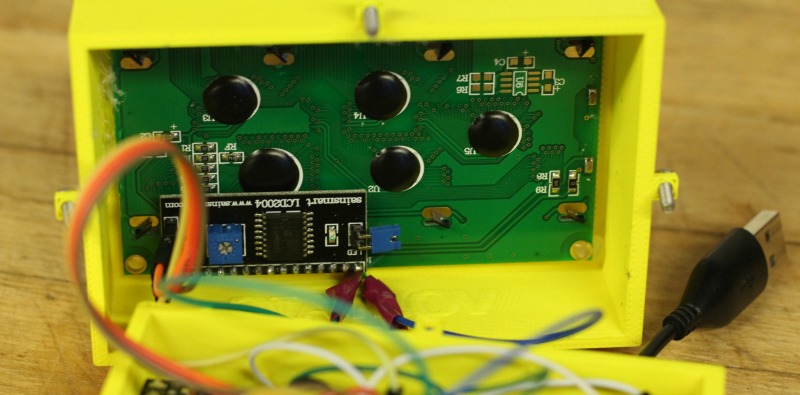
Data logger screen installed in case:
The complete data logger:
Software:
Now that you are done with wiring, it’s time to flash the code onto your Arduino microcontroller. The code is divided into different sections and commented in order to provide a better understanding. Post any questions about the code in the comments section below.
Code is available on Github at https://github.com/karimchamaa/VoltaicBatteryTest
System Power Consumption:
The data logger consumes 80mA at 5V with the screen dimmed, 130mA at 5V with the LCD screen brightened. This means our V44 battery pack (44 Watt hours) can power the system for about 10 hours with the screen dimmed.
Data Presentation:
To convert from the Arduino’s analog output (0-1023) from the voltage and current sensors, we applied the following formulas:
Voltage = analogRead(VoltagePin) / 40.92;
Current = (((analogRead(CurrentPin) * 5.0) / 1023.0) – 2.5) / 0.066;
This lined up somewhat consistently with other multi-meters, although we will need to spend more time fine-tuning the readings.
Charge Rate Monitoring:
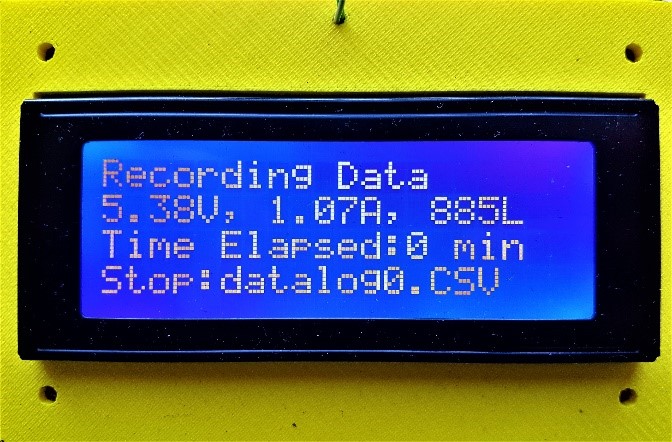
The data logging starts when the recessed switch is pressed and stops when it is pressed again. Voltage, current and luminosity measurements are appended in an Excel file and stored onto the SD card. After turning off the device, multiple excel file can be found each holding the name of “datalog” followed by the sequence number. In this example, we plotted the results of a test from the Arc 10W into a Samsung smartphone.
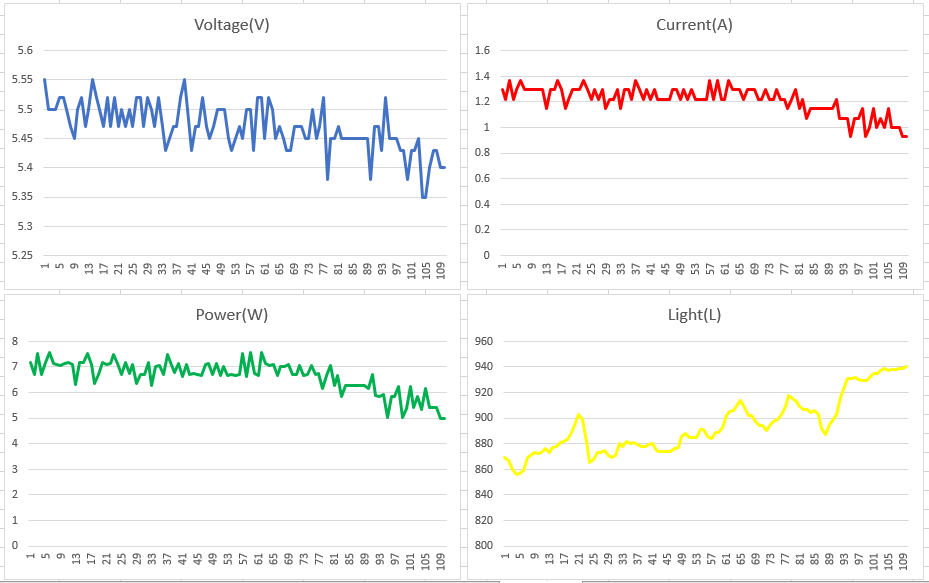
The Voltage, current, power, and light measurements are plotted with respect to time over a period of 109 minutes. Note that the power rate stays almost constant (Average 6.64W) while the phone is charging even though the light intensity varies. A slight decrease in the power is noticed after 85 minutes as the phone becomes full and the charge rate decreases.
About the Author: Karim Chamaa is a Mechatronics and Robotics Engineer. His portfolio can be found here.
what current sensor did you use? I use ACS712 and it didnt work
Hey! Is it possible to repurpose this as a data logger to record current and dat produced by a microbial fuel cell (mV and mA) ? Thanks!
Hi, want to run your setup only with a HC-SR04 (distance sensor). Could you help me with the code? LCD isn’t working. Would be great if you could contact me.
Thx
Good post, thank you.
At the risk of exposing my electronics ignorance: you say, “Also, make sure to power up the data logger device with a different power source than the one used to charge the portable device.” If I’m measuring the power output from a solar panel which is charging a battery, why couldn’t I power the Arduino via the same battery? (In my case a Voltaic V72.)
grate job, I have it in mind to add a temp sensor and attach it to the load to to monitor the load temp.