
Determining Solar Performance
In this article we’ll go over the differences in solar performance in cloudy, rainy, and sunny conditions.
We put together photos of different days along with measurement of solar intensity (measured in Watts per Meter) and output of a 6 Watt 6V solar panel connected to our V15 USB Battery. Clouds decrease solar panel power output significantly, ranging from about 50 to 100% reduction in power depending on the heaviness of the clouds.
Perfect Day
Sunny, not a cloud in the sky.
Solar Intensity: 980 Watts Per Meter (1,000 Watts Per Meter is the Standard)
Power Into Battery: 4.56 Watts, 4.93V / 930mA
Relative Power: 98%
High, Thin Clouds
Light cloud cover, but you can still see the sun. It will take about twice as long to charge your device than on a perfect day.
Solar Intensity: 510 Watts Per Meter
Power Into Battery: 2.3 Watts, 4.86V / 470mA
Relative Power: 50%

Party Cloudy
Big, fluffy clouds. Depending on the amount of clouds, these can be great days for charging.
Solar Intensity: 1080 Watts Per Meter when sunny, 115 Watts Per Meter behind the Clouds
Power Into Battery: 4.8 (Sunny) 0.7 (Behind Clouds)
Relative Power: 15 to 100%

Heavy Rain
Rainy, cannot see the sun. Little to no power produced.
Solar Intensity: 20 Watts per meter
Power Into Battery: 0
Relative Power: 0%

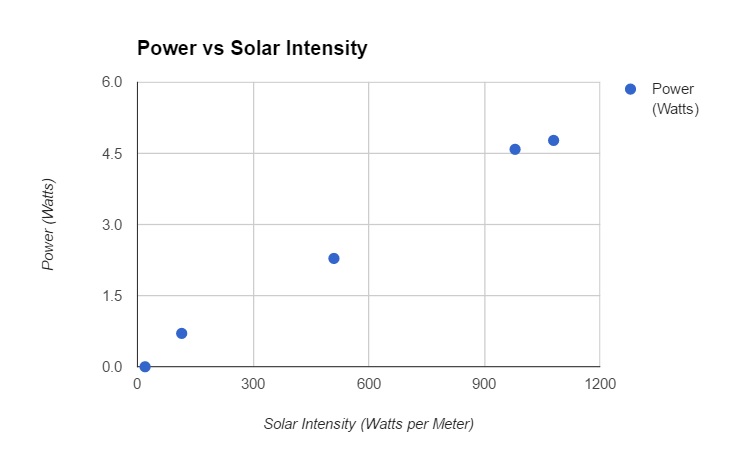
Solar Intensity vs Power (Watts)
Here is a summary of how much power the panel produces under various conditions. The power increases linearly with the increase in solar intensity.
 Still have questions? Find out how your solar panel should perform by contacting our technical team at support@voltaicsystems.com
Leave a Reply